How IRIS Works
IRIS stands for Interactive Rheology Information System. It provides an integrated environment that seamlessly connects experiments, models, visualization, and interpretation, enabling users to move efficiently from measurement to quantitative material knowledge.
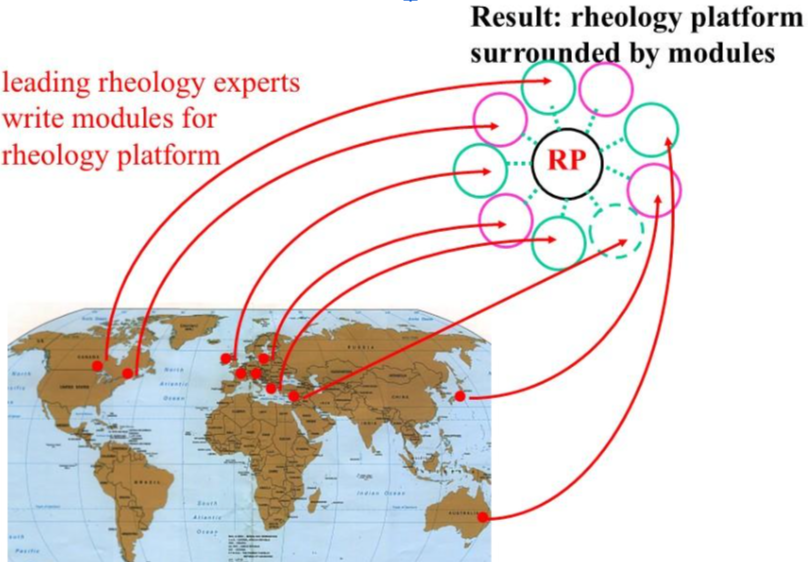
At its core is the IRIS Rheo-Hub, a central repository where experimental data, rheological models, scientific knowledge, and visualization tools are organized and interconnected within a common framework. A modular structure allows integration of a wide range of codes from rheologucal experts (see “functions” section).
Rather than treating data analysis, modeling, plotting, and interpretation as separate tasks, IRIS integrates them into a continuous workflow. Experimental results can be analyzed, compared, categorized, parameterized, and visualized while being directly linked to theoretical models. This makes it straightforward to test hypotheses, extract meaningful material parameters, and evaluate competing interpretations.
A distinctive feature of IRIS is the Smart Plot (SP). Every Smart Plot retains its complete provenance. With a single mouse click, users can return from any graph to the original experimental data, analysis procedures, and model calculations that produced it. This transparent connection between data, analysis, and graphical presentation makes results easy to verify, reproduce, modify, and communicate.
Developed over many years with contributions from numerous collaborators, IRIS combines advanced rheological methods with an intuitive user interface that encourages exploration, accelerates discovery, and supports confident scientific and engineering decision.
Publications about IRIS
10 Year Anniversary of IRIS: Winter HH, Mours M (2006) The cyber infrastructure initiative for rheology. Rheologica Acta 45:331-338
25 Year Anniversary of IRIS: Poh L, Narimissa E, Wagner MH, Winter HH (2022) Interactive shear and extensional rheology-25 years of IRIS software. Rheologica Acta 61:259-269